Data Science & Insights
Philippines Weather Insights: Patterns and Extremes (2000–2020)
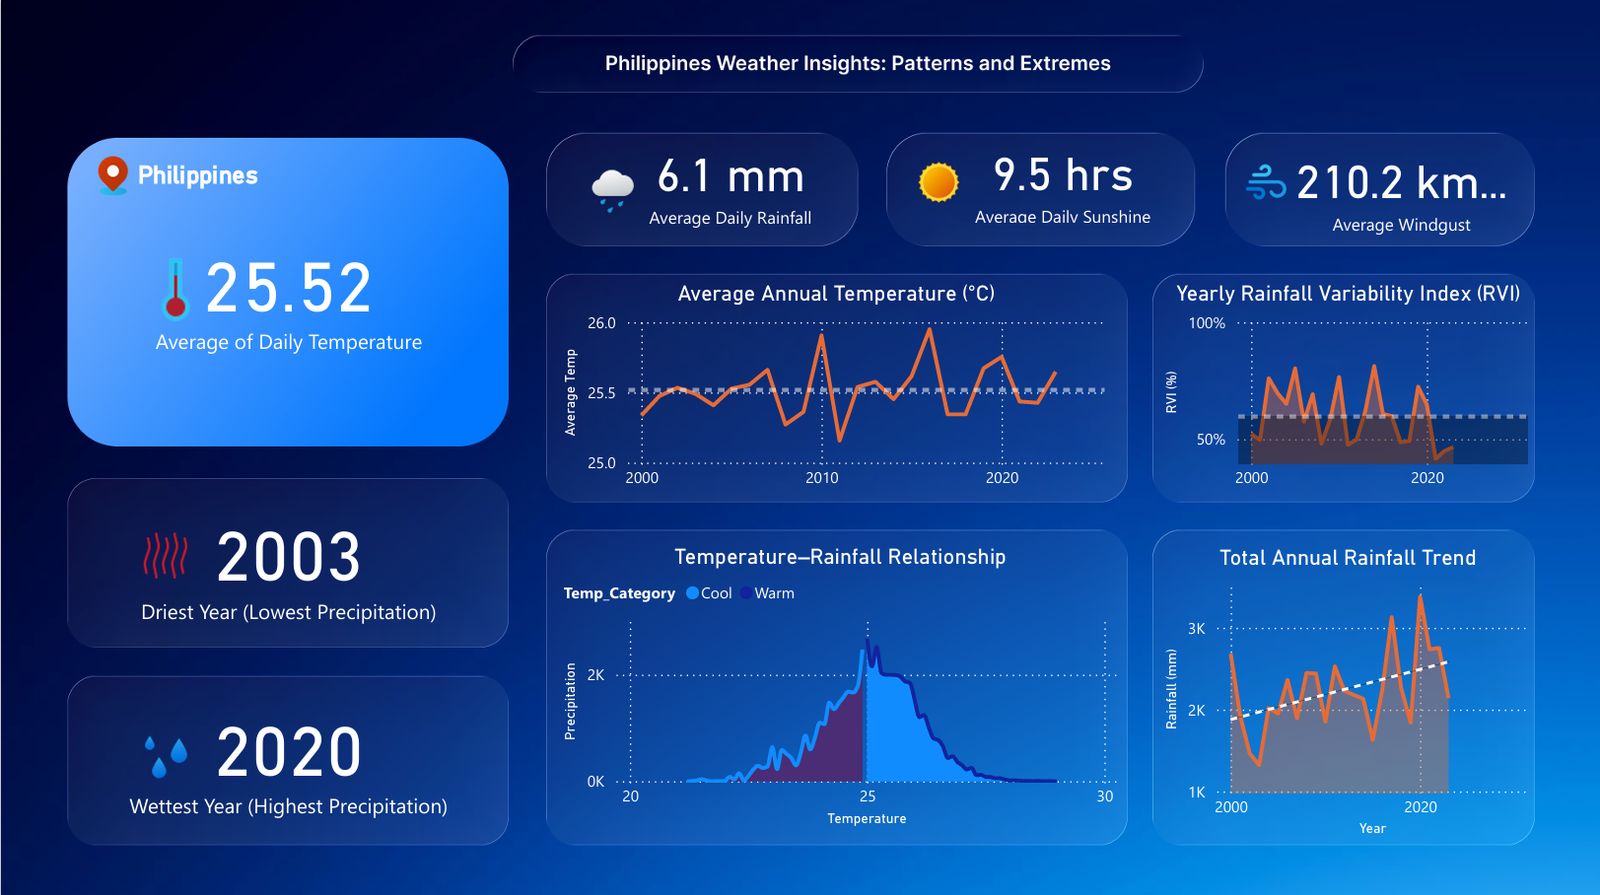
This dashboard provides a detailed longitudinal analysis of meteorological trends in the Philippines. By aggregating 20 years of climate data, the project identifies historical extremes, examines the correlation between temperature and precipitation, and tracks the intensifying trend of annual rainfall.
Technical Features & Insights
- 1. Historical Extremes & Benchmarking
- The dashboard establishes a clear baseline for the Philippine climate profile while highlighting significant anomalies:
- Average Metrics: Identifies a long-term average daily temperature of 25.52°C, paired with 6.1 mm of daily rainfall and 9.5 hours of sunshine.
- Historical Extremes: Pinpoints 2003 as the driest year and 2020 as the wettest year on record within the dataset, providing critical context for drought and flood risk assessment.
- 2. Time-Series Trend Analysis
- Temperature Fluctuations: The "Average Annual Temperature" line graph reveals a high degree of variability, with notable peaks around 2010 and 2016, consistent with global warming trends and regional El Niño/La Niña cycles.
- Rainfall Volatility: The "Yearly Rainfall Variability Index (RVI)" quantifies the inconsistency of precipitation, showing sharp oscillations that signal unpredictable monsoon seasons and changing climate patterns.