Data Science & Insights
Diabetes Prevalence & Risk Factor Analysis
This project features a comprehensive, multi-tabbed dashboard designed to analyze the complex interplay between lifestyle choices, clinical biomarkers, and socio-demographic factors on the prevalence of diabetes. Utilizing a dataset of over 76,000 cases, the dashboard translates complex statistical relationships into actionable health insights through intuitive visualization.
Technical Features & Insights
- 1. Global Overview & Feature Importance
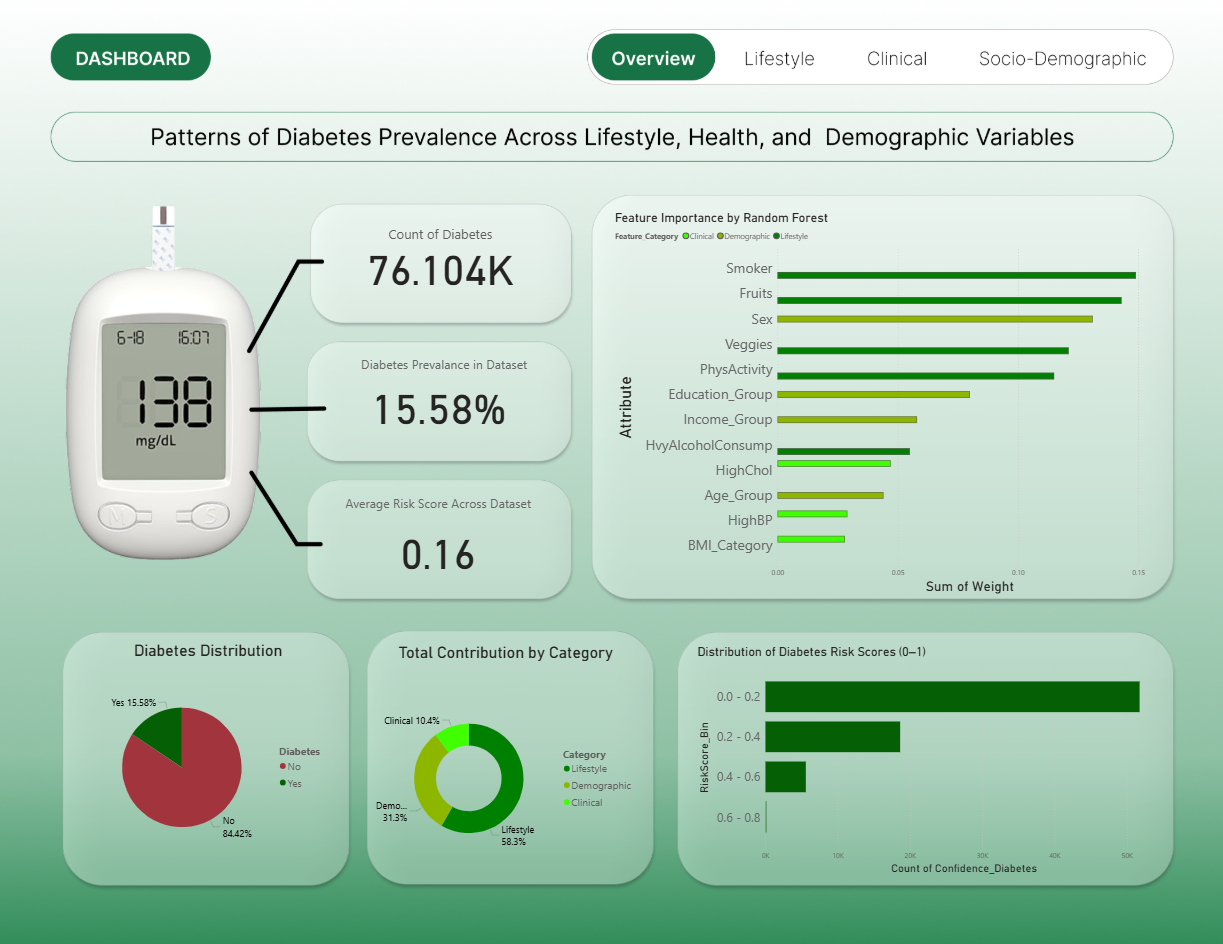
- The "Overview" tab establishes the baseline for the study, indicating a 15.58% prevalence rate within the dataset.
- Predictive Modeling: A Random Forest model was employed to rank feature importance. Smoking, Fruit Intake, and Sex emerged as the top three predictors of diabetes risk.
- Risk Distribution: Most individuals fall within a low-risk score category (0.0–0.2), though a significant tail of high-risk individuals is clearly identified for targeted intervention.
- 2. Lifestyle Impact Analysis
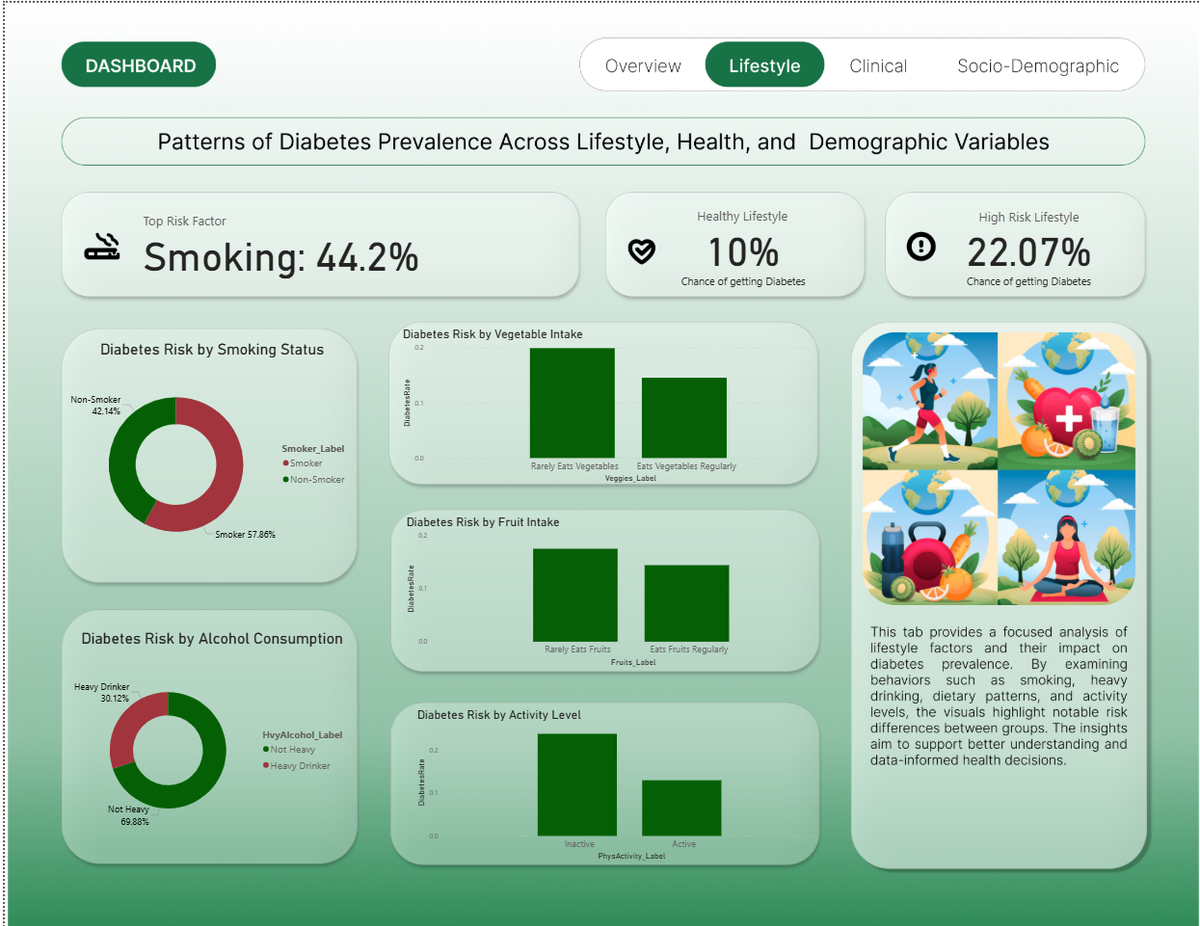
- This section quantifies how daily habits correlate with health outcomes.
- The "Smoking Factor": Identified as the top risk factor, with smokers showing a 44.2% higher prevalence than non-smokers.
- Protective Behaviors: The dashboard highlights a "Healthy Lifestyle" baseline (10% risk) versus a "High Risk Lifestyle" (22.07% risk), emphasizing that regular vegetable/fruit intake and physical activity significantly lower the probability of diagnosis.
- 3. Clinical Biomarkers & Risk Stratification
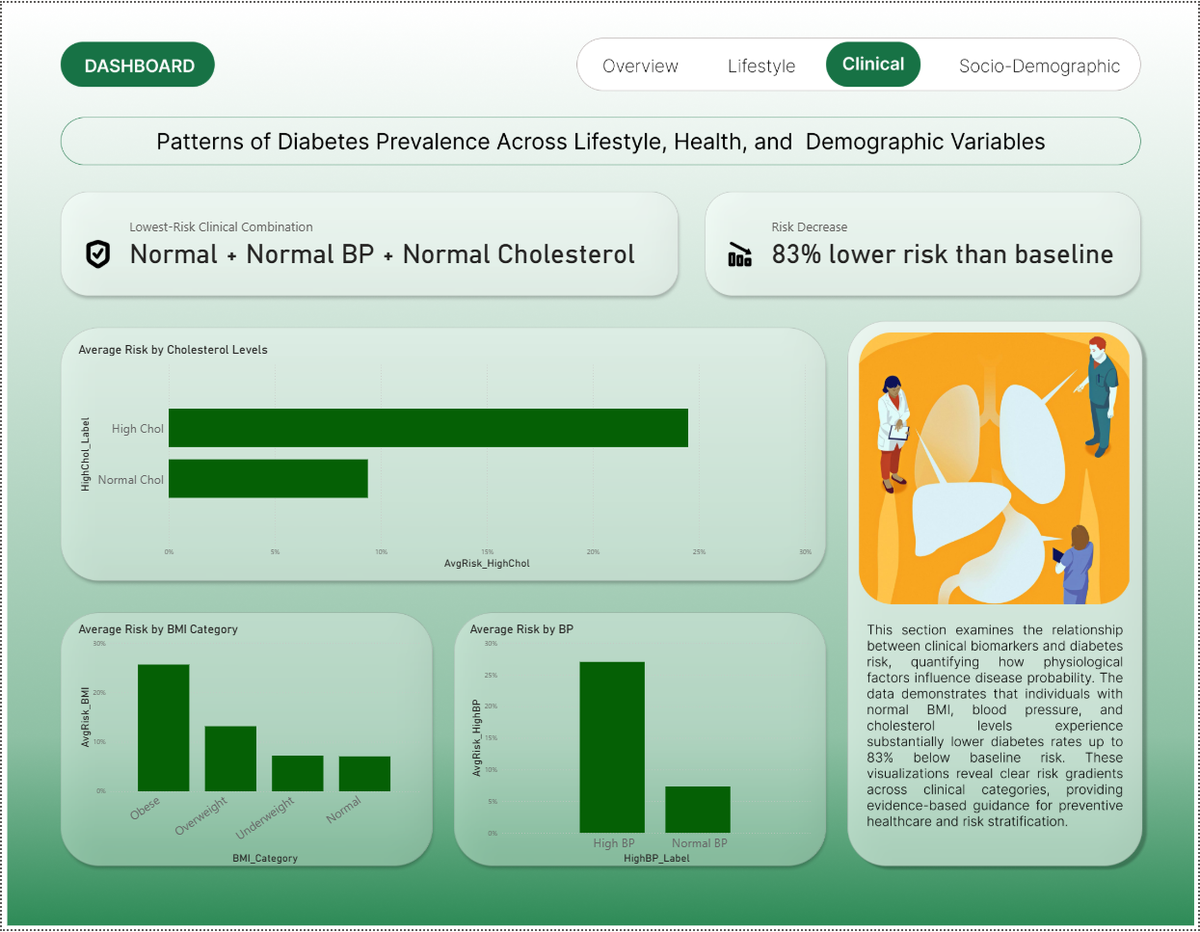
- The "Clinical" tab focuses on physiological metrics like BMI, Blood Pressure (BP), and Cholesterol.
- The "Gold Standard" Profile: Individuals with Normal BMI, Normal BP, and Normal Cholesterol experience an 83% lower risk than the baseline.
- Clear Gradients: Visualizations reveal a stark escalation in risk for obese individuals and those with high blood pressure, providing a clear map for clinical risk stratification.
- 4. Socio-Demographic Disparities
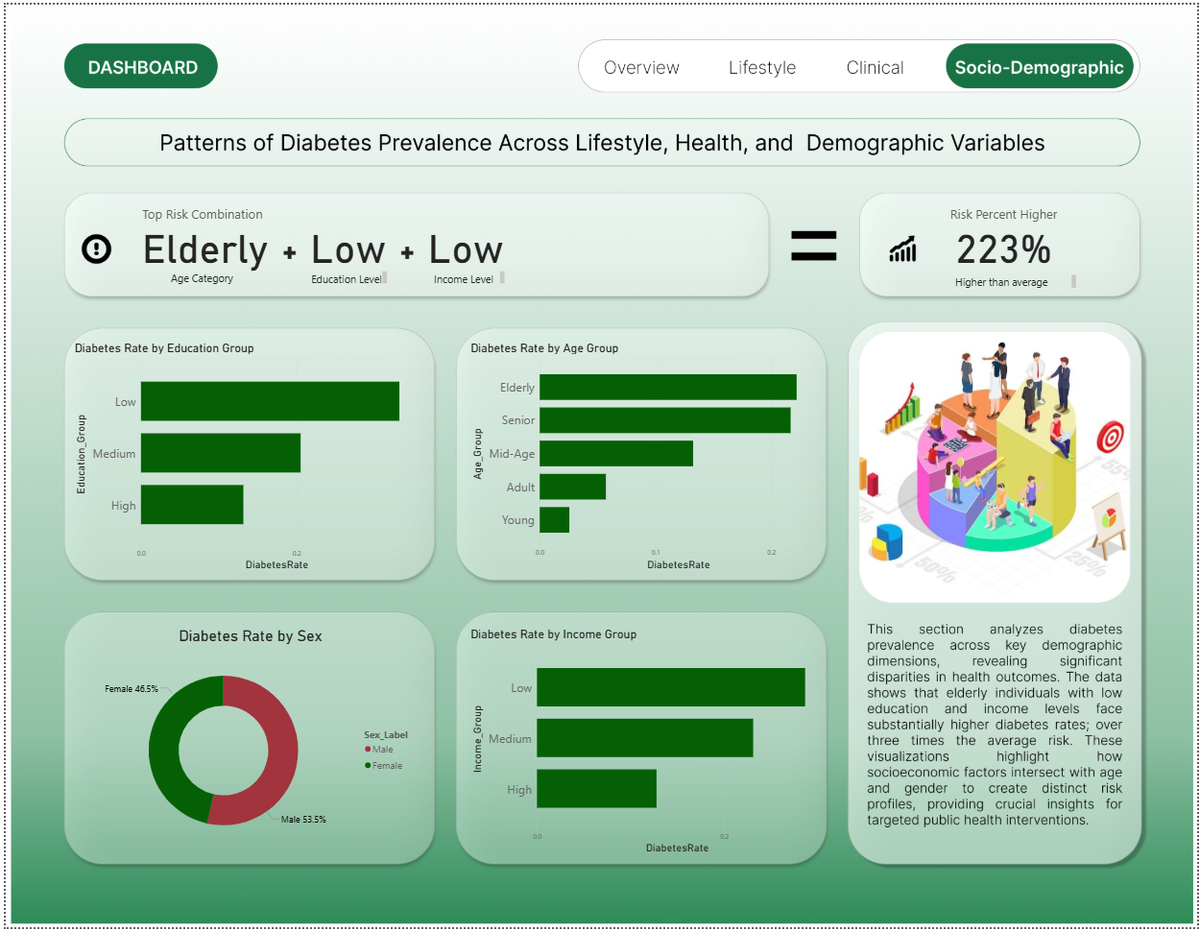
- The final tab explores the intersectionality of age, education, and income.
- Vulnerable Populations: The analysis identifies a "Top Risk Combination"—Elderly + Low Education + Low Income—which results in a risk 223% higher than average.
- Socioeconomic Insight: The data demonstrates that higher income and education levels generally correlate with lower diabetes rates, highlighting the need for public health interventions that address social determinants of health.