Data Science & Insights
Malaria Patient Analytics & Diagnostic Predictive Modeling
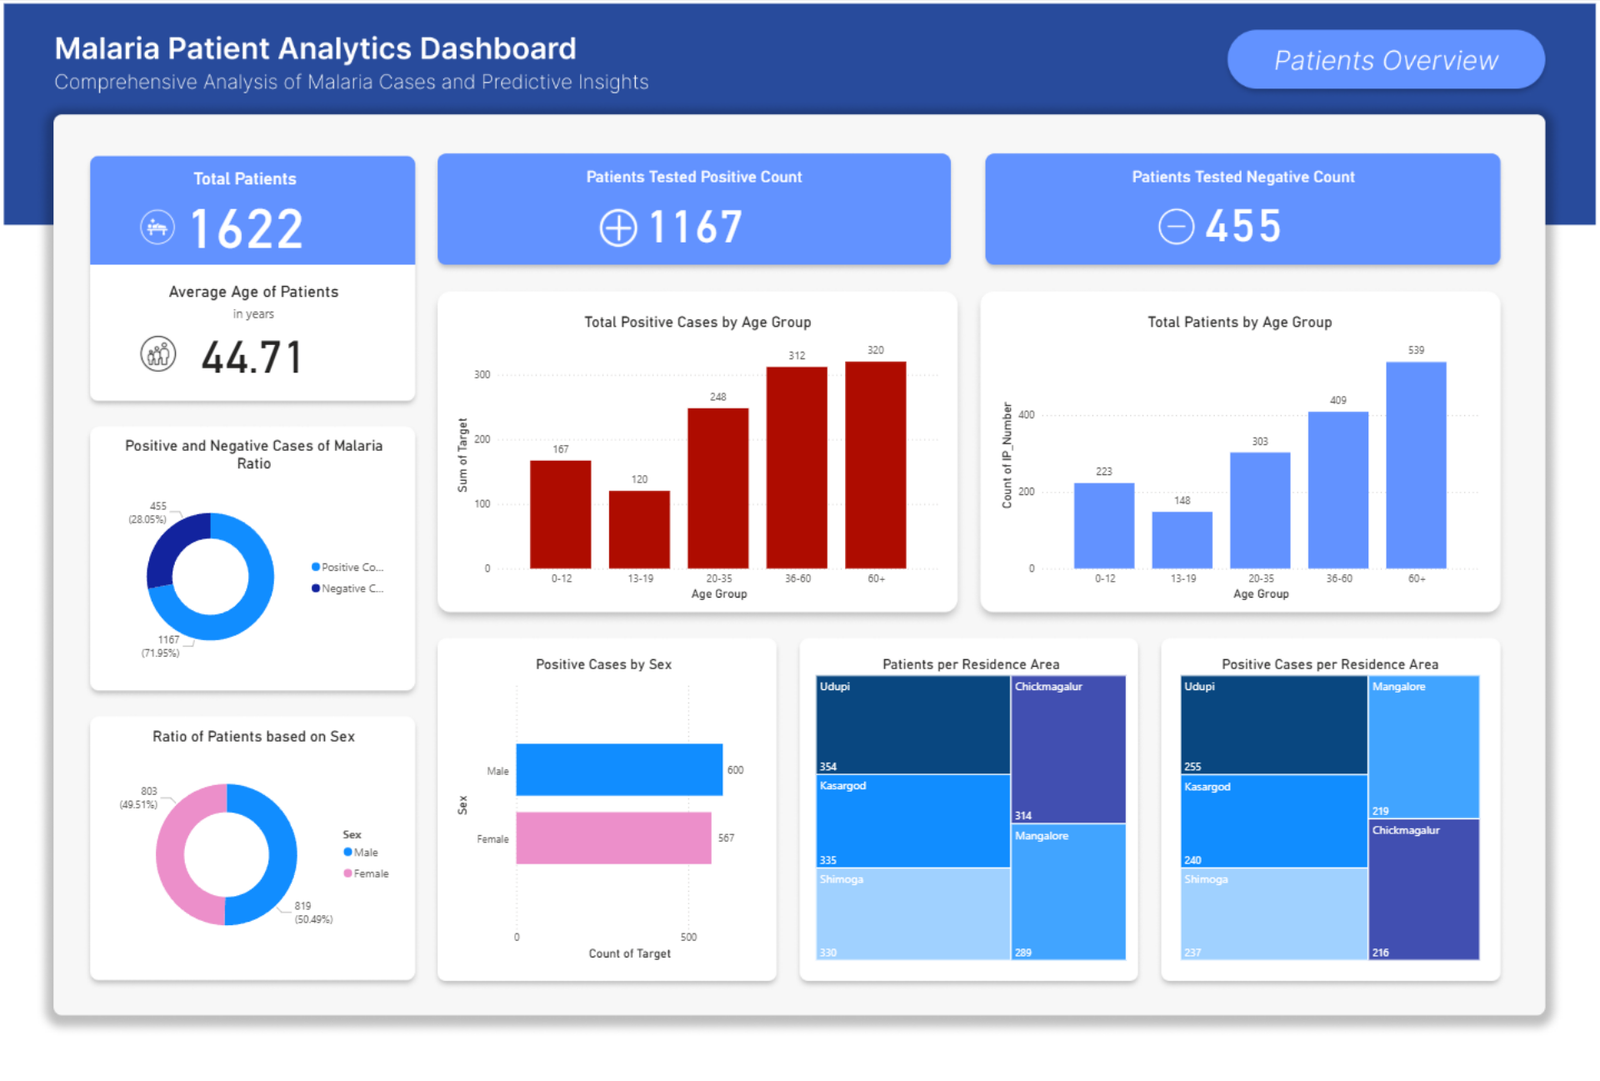
This two-part analytical dashboard provides a comprehensive look at malaria case distribution while evaluating the performance of a predictive model designed to assist in early diagnosis. By analyzing a cohort of 1,622 patients, the project identifies high-risk demographic clusters and validates a machine learning approach to symptom-based screening.
Technical Features & Insights
- 1. Epidemiological Surveillance (Patients Overview)
- The first phase of the analysis establishes the "where" and "who" of the outbreak.
- Demographic Vulnerability: The data reveals a significant concentration of positive cases in the 36–60 and 60+ age groups, suggesting that while the average patient age is 44.71, older populations carry a higher disease burden in this dataset.
- Geospatial Analysis: Utilizing treemaps, the dashboard identifies Udupi and Chickmagalur as primary hotspots for positive cases, enabling data-driven decisions for medical supply distribution.
- Gender Parity: The patient ratio is nearly equal (50.49% Male vs. 49.51% Female), indicating that transmission risk in these areas is likely environmental rather than occupationally gender-biased.
- 2. Machine Learning & Predictive Accuracy (Diagnostic Insights)
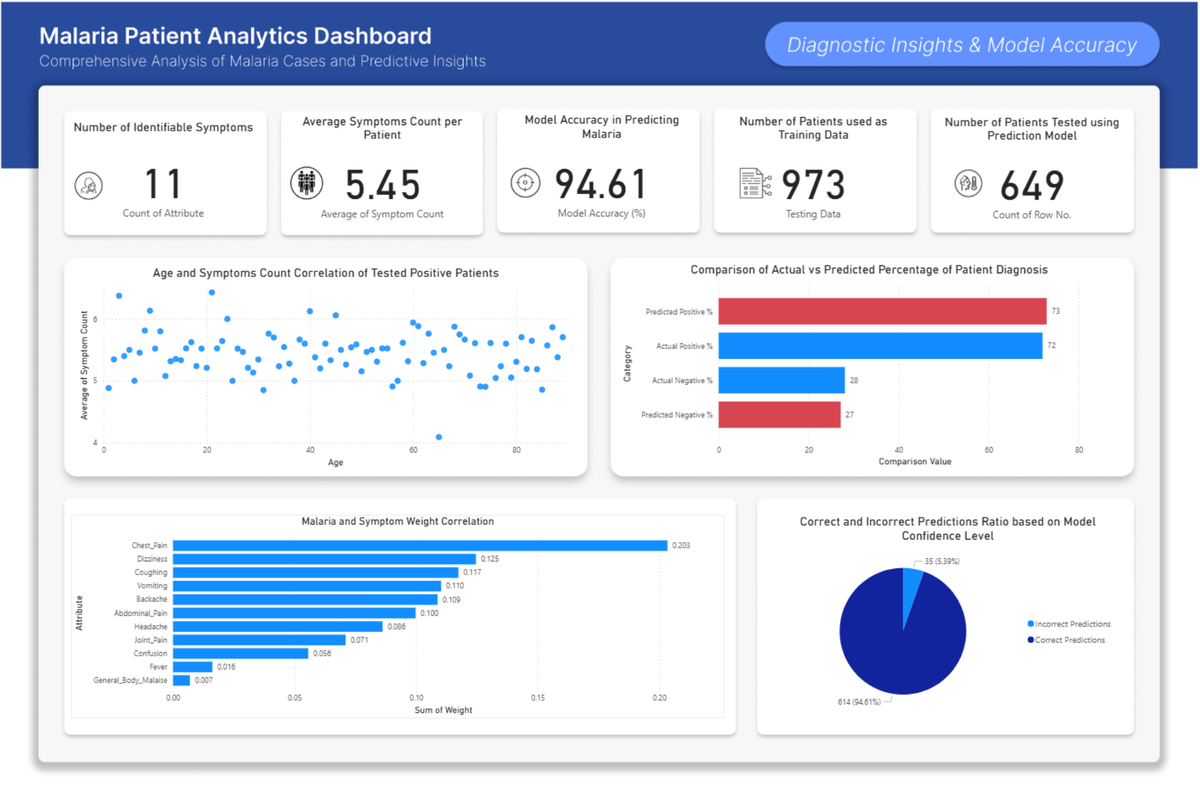
- The second phase evaluates a classification model trained on 11 identifiable symptoms to predict malaria positivity.
- High-Confidence Performance: The model achieved an impressive 94.61% accuracy rate in predicting malaria presence. The "Correct vs. Incorrect" ratio highlights only 35 incorrect predictions out of 649 tested cases.
- Symptom Weight Correlation: Through attribute importance analysis, Chest Pain, Dizziness, and Coughing were identified as the highest-weighted predictors for a positive diagnosis.
- Model Validation: A comparison of "Actual vs. Predicted" diagnosis shows a tight alignment (72% actual positive vs. 73% predicted), confirming the model's reliability for clinical decision support.
- 3. Correlation Analysis
- Symptom Complexity: The dashboard tracks the correlation between age and symptom count (averaging 5.45 symptoms per patient), showing a consistent symptom load across different age brackets, which reinforces the model’s stability across demographics.